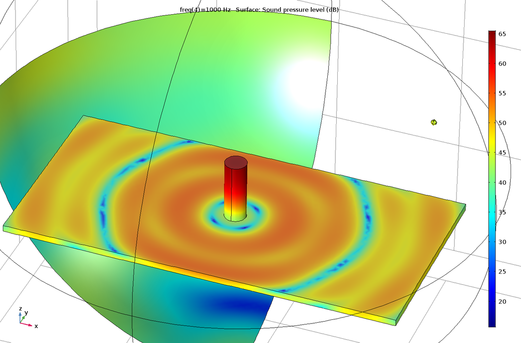
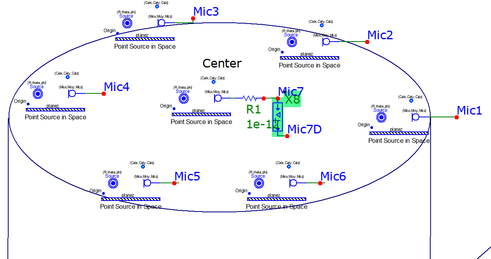
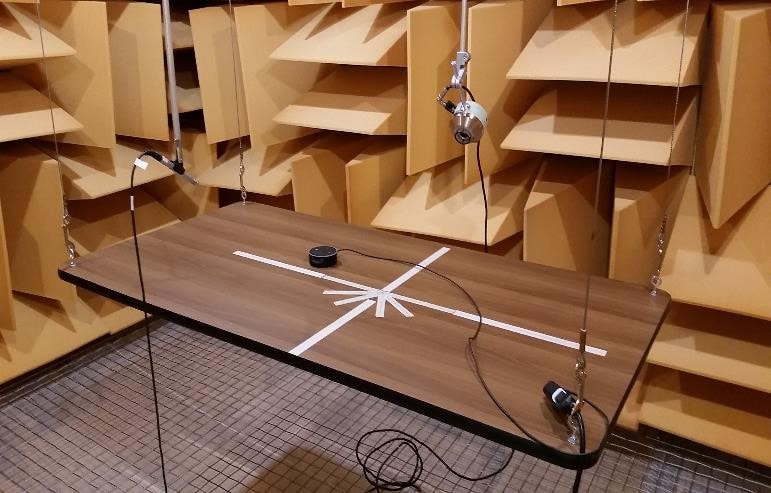
Indy Acoustic Research
  • Home
  • People
  • Services
    • Consulting
    • Testing
    • Product Design
  • Blog
  • Contact
  • Employment

Joint IAR + Listen Talk on Measurements of Cloud-Based Audio Devices

10/18/2017

 
Below is a full copy of the joint IAR + Listen presentation given at the 143rd AES Convention October 21, 2017.  IAR can measure send (microphone) and receive (speaker) responses of "cloud-only" audio devices using Listen SoundCheck software.
aes143_iot_smart_speaker_testing_web.pdf
File Size: 1692 kb
File Type: pdf
Download File

Picture
Picture

Central Indiana AES Visits IAR

3/23/2017


Larry Marcus and Marc Reese

The Central Indiana Section of Acoustical Engineering Society (CI-AES) held its March meeting at Indy Acoustic Research LLC with approximately 20 members in attendance.

Humorously dubbed "now for something completely different" (echoing Monty Python), IAR demonstrated the world of embedded audio- where a "large, full-range" speaker is 40 or 50mm diameter. Participants observed testing of voice-controlled virtual assistants in the anechoic chamber, headphone testing in interfering noise in the sound booth and simulation examples of headphone design.
Picture
Glenn explains details of acoustic testing on cloud-based virtual assistants.
Picture
Method for displacement measurement to obtain T-S Parameters

Dust & Water Resistant Barrier Effects On Microphone PerformancE

12/5/2016


Larry Marcus
principle transducer and telecom engineer

Many wireless phones tout their water resistance these days.  BUT, for microphones, there are several potential problems the designer must be aware of before using environmental shielding barriers.  These barriers or membranes that give so-called “better than IP67 protection” (see the IEC 60529 dust and water ingress protection standard) have both acoustic mass and acoustic resistance which will affect the microphone performance.  The main effect for omnidirectional mic installation is that the sensitivity will be lowered a small amount and the upper end of the response can be changed due to shifts in acoustic resonances.  Much more drastic effects can be seen in arrays of omnidirectional or gradient/differential mics.  In these mics, the mass and resistance and the associated variation of these properties can severely shift the polar/directional characteristics and the sensitivity.  These shifts in performance are due to the subtraction of the pressures electrically in the case of omni arrays or acoustical subtraction in the case of a gradient mic.  Subtracting large numbers to get small numbers as in these cases yields small numbers that still carry the large variation effects.  So, besides matching omnidirectionals for sensitivity and response for arrays (not even mentioning the other confounding issue, self-noise) or selecting a good gradient/directional mic, careful attention must be paid to the surrounding acoustical elements, INCLUDING THE BARRIER ELEMENTS, in any design.

IAR Turns ONE

4/4/2016

 
By: Marc Reese and Larry Marcus
​
Indy Acoustic Research celebrates its first year! 

A lot of effort has gone this year into building our lab's capabilities to ensure we can support our customer's needs and timing. Below are some pictures of some of our activities in the past few months.
Picture
Indy Acoustic Research now has the capability to measure speaker displacement directly though a non-contact laser.
Picture
We're just baffled! An IEC-60268 spec baffle allows for testing speaker components up to 3" diameter.
Picture
Simulation improvements have been made for leaky ear models (4195, shown), Transmission Line models of circular and rectangular tubes and radiation patterns of loudspeakers.
Picture
Perceptual Objective Listening Quality Analysis (POLQA) testing on HATS in a customer-defined diffuse noise profile requires that SoundCheck, DAW and POLQA software are run simultaneously
Picture
One of the annoyances in the venerable B&K 4128 HATS is that the chin clip for holding the mic splits due to the stress concentration from inserting the mic. A fuse clip costing less than a dollar is an economical fix with no measurable change to the acoustic field.

Bell Labs Indianapolis Anechoic Chamber History

11/17/2015

 
by: Larry Marcus

Built in 1984, the IAR Anechoic Chamber is like me: it’s old but it still works. It has a cutoff frequency of about 120Hz and is about 3 meters by 3.7 meters by 2.6 meters tip-to-tip.  Compare the photo here with the more recent one below in this blog series with the four intrepid IAR founders!

Significant products developed and studies conducted in our anechoic chamber include many IEEE and TIA standards contributions, the first gradient microphones with speakerphones, first extensive ISDN and VoIP testing, first mechanical-acoustical analysis of conference phones, etc., not to mention days upon days of other transducer development and product testing.
Picture
Former Bell Labs colleague Rich Sachs stringing floor cables
Picture
The wedges were white? Must have absorbed so much sound over the years that they've turned yellow!

Polar Plots Using Excel Radar Chart

10/14/2015

 
Picture
​Excel is a great tool for engineering data reporting due to its widespread use. However, it has never supported a good polar plot which is an essential plot type in multiple engineering disciplines, including acoustics.  The major workarounds I’ve seen are to either download a plugin (which is difficult if you don’t have admin rights) or convert (theta,R) into x=R*cos(theta) and y=R*sin(theta) and use a scatter plot. However, the latter method can take up a lot of spreadsheet space -especially if you have multiple sets of data.
 
It turns out the chart type that you always thought should be able to plot a polar – the Radar Chart – CAN do it; however, there is still some frustration with the formatting of axes. Thankfully, if you work through the frustration once and save the completed chart as a template, it’s much easier to reuse future data sets. See the below attachment for instructions using Excel 2016. There are some differences with older versions, but hopefully you can follow along also...
​
iar-_polar_plots_in_excel.pdf
File Size: 493 kb
File Type: pdf
Download File

Diffuse Field Booth

9/18/2015

 
The Diffuse Field Booth is a large audiometric booth and features 8 pro-audio surround speakers and one subwoofer. This setup is calibrated per IEEE 269 to accurately simulate a diffuse noise field, so it's perfect for testing the noise rejection of headset or handset microphones, or noise isolation of headphones (either passive or active noise-cancelling types).  
Picture
HATS in the simulated surround field.

New LAB=OLD LAB

7/20/2015

 
IAR has moved back into the old lab!  The lab has a fully anechoic chamber for far-field devices, Head and Torso simulator (HATS) for near field devices and diffuse field booth for noise isolation measurements. And yes, some desk space for sippin' coffee.
Picture
It's been home for a while, but the gang is now proud to have their own anechoic chamber
Forward>>
    View my profile on LinkedIn

    RSS Feed

    Archives

    December 2021
    July 2021
    March 2021
    January 2021
    March 2020
    January 2019
    March 2018
    October 2017
    March 2017
    December 2016
    April 2016
    November 2015
    October 2015
    September 2015
    July 2015

    Categories

    All
    Equipment
    Excel
    Glenn Hess
    Larry Marcus
    Marc Reese
    Shannon McConnell
    Simulation
    SoundCheck
    The Lab
    Tricks Of The Trade

Copyright ©2015-2022 Indy Acoustic Research LLC. All Rights Reserved.
​