Indy Acoustic Research
  • Home
  • People
  • Services
    • Consulting
    • Testing
    • Product Design
    • Teams Pre-Certification
  • Blog
  • Contact
  • Employment
  • Partners

Form 4 Printer Addition

6/25/2024

 
Picture
IAR is thrilled to introduce a significant enhancement to our prototyping capabilities: the Form 4 SLA Printer. This cutting-edge technology vastly improves our ability to swiftly address detailed acoustic queries such as "what happens when I change XYZ...?"

​IAR has prototyped plastic parts using a Fused Deposition Method (FDM) printer (Prusa), supplemented by a large-format resin printer (Peopoly L) added three years ago. While FDM remains ideal for economical and rapid fixturing solutions, its melted plastic lines and occasional air gaps between layers act acoustically like a highly resistive porous wall, necessitating epoxy coating of thin enclosure walls for transducer applications—a labor-intensive process.


Read More

Exploring Audio for Smart Glasses: A Look into Open Ear Speaker Design

1/18/2024

 
The use of non-occluding off-ear audio speakers has significantly increased in recent years, driven by the growth of Augmented Reality (AR), Virtual Reality (VR), and smart glasses assistant products. These devices contribute to the existing array of products with off-ear audio, such as sport earphones, hearing assistants (hearables), and open ear  headphones.

There are several advantages to open ear audio systems. In terms of comfort, the ear pinna and tragus are highly sensitive, making it beneficial to leave them untouched for long-term product wearability. An open design also eliminates concerns about thermal buildup. Furthermore, the acoustic waves of the sound source to naturally diffract around a user's ear which has benefits for perceived spaciousness (stereo image/ERTF) and sound source localization, contributing to the advancement of AR/VR scene realism.

However, a major audio issue with these devices is usually limited bandwidth. Traditional headphone designs require a seal to the ear to reproduce low frequencies with a small driver. Conversely, sealed box microspeaker designs such as those found in laptops and cell phones need a large speaker diaphragm or displacement (volume velocity) and back air volume to produce both low frequencies and the required output level. Such a large and heavy implementation is not typically possible on head-worn products. High frequencies are also often compromised by porting designs and diaphragm break-up modes. This article demonstrates a method of open ear speaker design known as the Dipole design, which utilizes the proximity effect to enhance low-frequency output and increase privacy (the ability of others nearby to hear the wearer's audio). One potential tradeoff, among many possibilities, is illustrated when implementing the dipole effect stretched excessively, impacting high-frequency response.

Smart Glasses Free-Field Measurement

A commercially available smart glasses product has two ports for the speaker in the stem near the ear:
Picture

Read More

Voice Coil: March 2021 Article

3/1/2021

 
Picture
Indy Acoustic Research collaborated with Listen, Inc. to bring the data behind the article "How to Measure Free-Field Speaker Response without an Anechoic Chamber" featured in the March 2021 Voice Coil article, linked below!

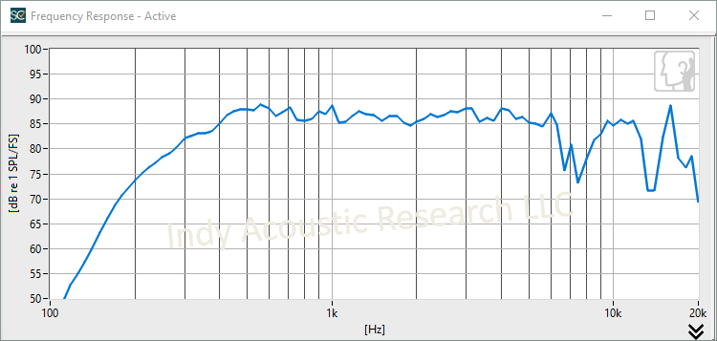
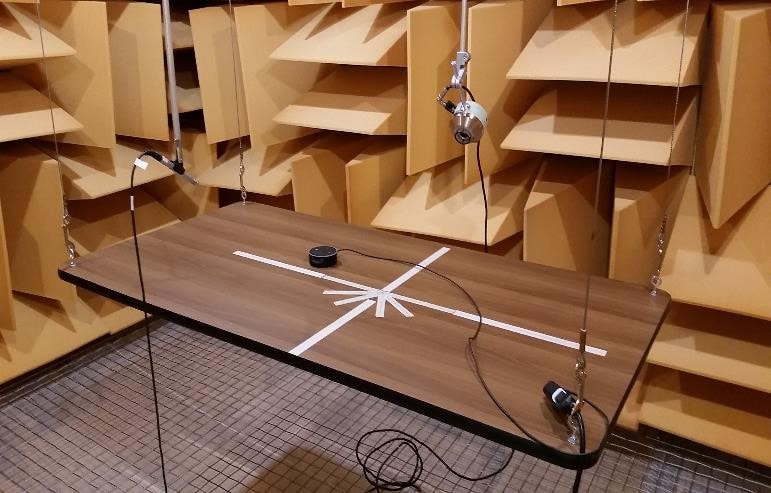
The hybrid splice method of loudspeaker frequency response measurement compares well with an anechoic chamber for a single loudspeaker if the splice frequency can be determined. However, complex devices require the greater flexibility in setup conditions and off-angle measurements afforded by a full chamber. 
article_vc_mar2021_simulated_free_field.pdf
File Size: 8919 kb
File Type: pdf
Download File

3D Printing in-House

3/21/2018

 
To speed iterative prototyping and fixture creation for some assemblies and housings, IAR has brought reliable and low-cost FDM prototyping in-house. Common items we print include speaker baffle adapters, customer housing mockups for probe microphone measurements, or other fixtures to support device assembly or measurements. Maximum print size on this device is approximately 9 x 8 x 8 inches. High-resolution SLA and smaller assemblies will continue to be sourced from a handful of Indianapolis-based prototyping shops.
Picture

Simulation of Microphone Arrays

3/19/2018

 
Picture
 Many far-field voice devices employ beamforming microphone arrays to improve speech recognition and communication performance. However, often the simulation of the acoustic wave during DSP design only includes phase differences due to array spacing and neglects more complex geometry such as element porting, enclosures, tables or walls.  These objects cause diffraction and reflections of the incoming acoustic wave around the sensor can lead to errors in beamforming and direction-of-arrival algorithms. IAR can use Comsol Multiphysics or Lumped Element Simulation (depending upon the complexity of geometry, frequency range of interest and available time) to provide simulated complex acoustic pressure “vectors” to DSP designers to improve the performance of the array including geometric features, prior to any prototype production or PCB fabrication.

Picture

Joint IAR + Listen Talk on Measurements of Cloud-Based Audio Devices

10/18/2017

 
Below is a full copy of the joint IAR + Listen presentation given at the 143rd AES Convention October 21, 2017.  IAR can measure send (microphone) and receive (speaker) responses of "cloud-only" audio devices using Listen SoundCheck software.
aes143_iot_smart_speaker_testing_web.pdf
File Size: 1692 kb
File Type: pdf
Download File

Picture
Picture

Central Indiana AES Visits IAR

3/23/2017


Larry Marcus and Marc Reese

The Central Indiana Section of Acoustical Engineering Society (CI-AES) held its March meeting at Indy Acoustic Research LLC with approximately 20 members in attendance.

Humorously dubbed "now for something completely different" (echoing Monty Python), IAR demonstrated the world of embedded audio- where a "large, full-range" speaker is 40 or 50mm diameter. Participants observed testing of voice-controlled virtual assistants in the anechoic chamber, headphone testing in interfering noise in the sound booth and simulation examples of headphone design.
Picture
Glenn explains details of acoustic testing on cloud-based virtual assistants.
Picture
Method for displacement measurement to obtain T-S Parameters

IAR Turns ONE

4/4/2016

 
By: Marc Reese and Larry Marcus
​
Indy Acoustic Research celebrates its first year! 

A lot of effort has gone this year into building our lab's capabilities to ensure we can support our customer's needs and timing. Below are some pictures of some of our activities in the past few months.
Picture
Indy Acoustic Research now has the capability to measure speaker displacement directly though a non-contact laser.
Picture
We're just baffled! An IEC-60268 spec baffle allows for testing speaker components up to 3" diameter.
Picture
Simulation improvements have been made for leaky ear models (4195, shown), Transmission Line models of circular and rectangular tubes and radiation patterns of loudspeakers.
Picture
Perceptual Objective Listening Quality Analysis (POLQA) testing on HATS in a customer-defined diffuse noise profile requires that SoundCheck, DAW and POLQA software are run simultaneously
Picture
One of the annoyances in the venerable B&K 4128 HATS is that the chin clip for holding the mic splits due to the stress concentration from inserting the mic. A fuse clip costing less than a dollar is an economical fix with no measurable change to the acoustic field.

Polar Plots Using Excel Radar Chart

10/14/2015

 
Picture
​Excel is a great tool for engineering data reporting due to its widespread use. However, it has never supported a good polar plot which is an essential plot type in multiple engineering disciplines, including acoustics.  The major workarounds I’ve seen are to either download a plugin (which is difficult if you don’t have admin rights) or convert (theta,R) into x=R*cos(theta) and y=R*sin(theta) and use a scatter plot. However, the latter method can take up a lot of spreadsheet space -especially if you have multiple sets of data.
 
It turns out the chart type that you always thought should be able to plot a polar – the Radar Chart – CAN do it; however, there is still some frustration with the formatting of axes. Thankfully, if you work through the frustration once and save the completed chart as a template, it’s much easier to reuse future data sets. See the below attachment for instructions using Excel 2016. There are some differences with older versions, but hopefully you can follow along also...
​
iar-_polar_plots_in_excel.pdf
File Size: 493 kb
File Type: pdf
Download File

Diffuse Field Booth

9/18/2015

 
The Diffuse Field Booth is a large audiometric booth and features 8 pro-audio surround speakers and one subwoofer. This setup is calibrated per IEEE 269 to accurately simulate a diffuse noise field, so it's perfect for testing the noise rejection of headset or handset microphones, or noise isolation of headphones (either passive or active noise-cancelling types).  
Picture
HATS in the simulated surround field.
<<Previous
    View my profile on LinkedIn

    RSS Feed

    Archives

    June 2025
    May 2025
    June 2024
    January 2024
    February 2023
    December 2021
    July 2021
    March 2021
    January 2021
    March 2020
    January 2019
    March 2018
    October 2017
    March 2017
    December 2016
    April 2016
    November 2015
    October 2015
    September 2015
    July 2015

    Categories

    All
    Equipment
    Excel
    Glenn Hess
    Larry Marcus
    Marc Reese
    Shannon McConnell
    Simulation
    SoundCheck
    The Lab
    Tricks Of The Trade

Copyright ©2015-2025 Indy Acoustic Research LLC. All Rights Reserved.
​